


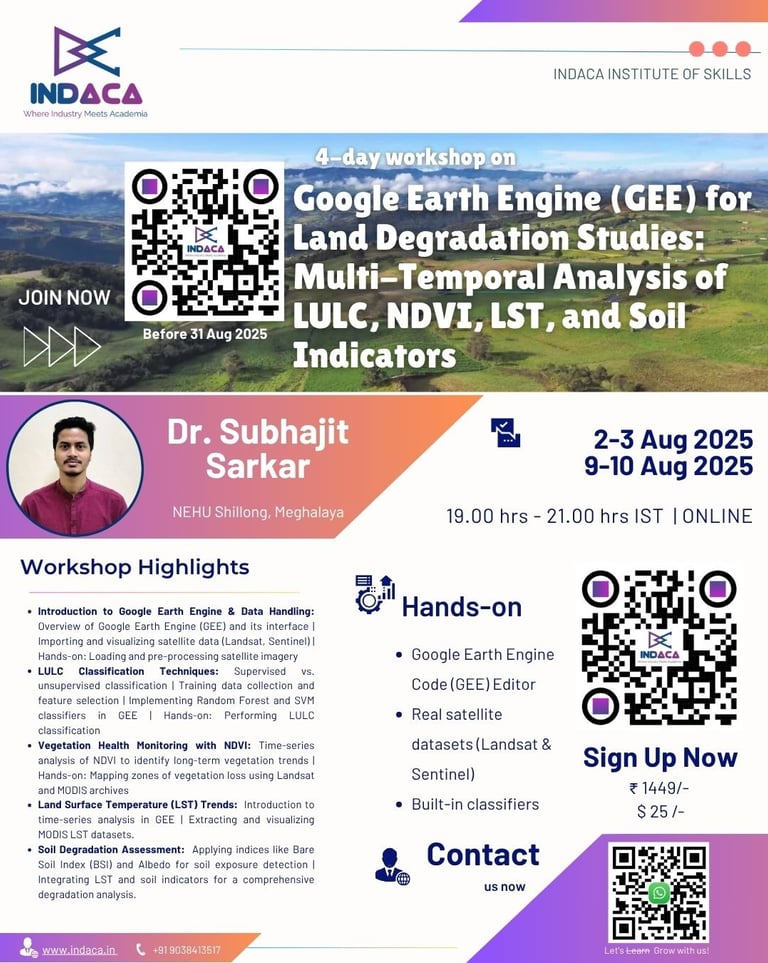
5 day online workshop on
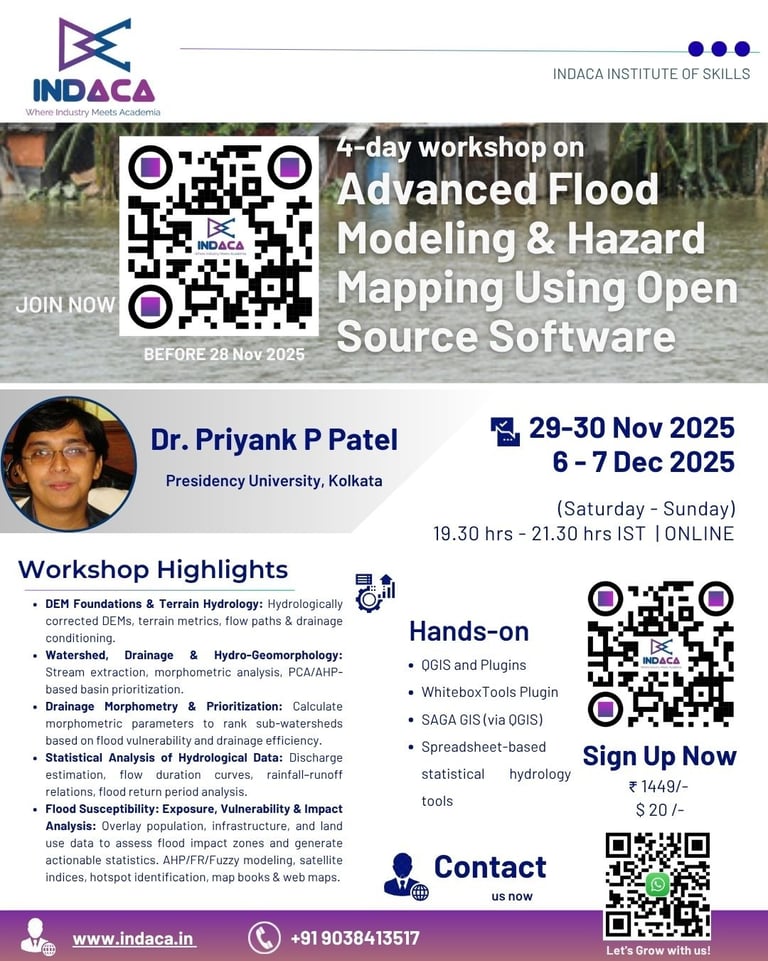
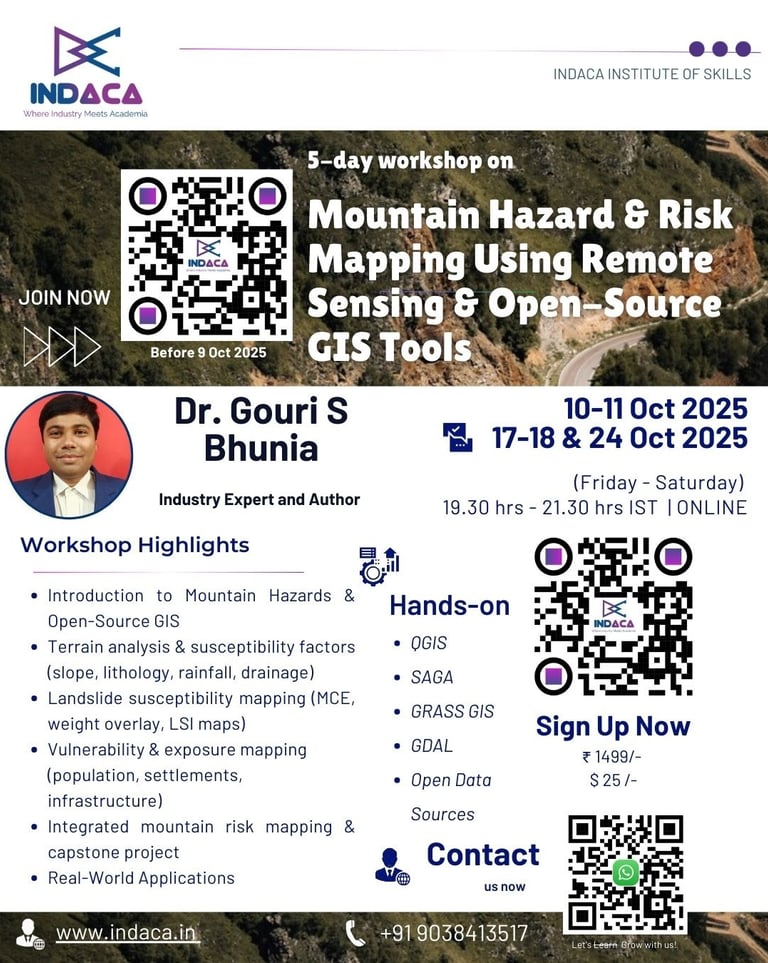
Mountain Hazard & Risk Mapping Using Remote Sensing & Open-Source GIS Tools
Master Practical Skills in Remote Sensing & Open-Source GIS for Mountain Hazard and Risk Assessment.
Mountain regions face frequent hazards such as landslides, rockfalls, debris flows, avalanches, and glacial lake outburst floods (GLOFs). Understanding these risks and mapping them effectively is essential for researchers, planners, and policymakers working in fragile ecosystems.
This 5-day live online workshop will guide you step by step in using open-source GIS tools like QGIS, SAGA, and GRASS to analyze terrain, identify hazard-prone areas, and generate risk zonation maps. With a hands-on approach, you will not only learn the science behind hazard and risk mapping but also gain practical skills to apply in real-world mountain environments.
Course Details:
Dates: Oct 10-11 and Oct 17-18 & Oct 24, 2025
Duration: 5 Days | 2 Hours per Day | Total 10 Hours
Timings: 7:30 PM – 9:30 PM IST
Mode: Live Online via Zoom
Language of Instruction: English
Certificate: E-Certificate of Participation
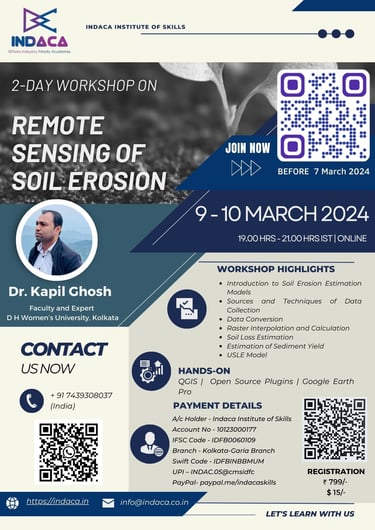
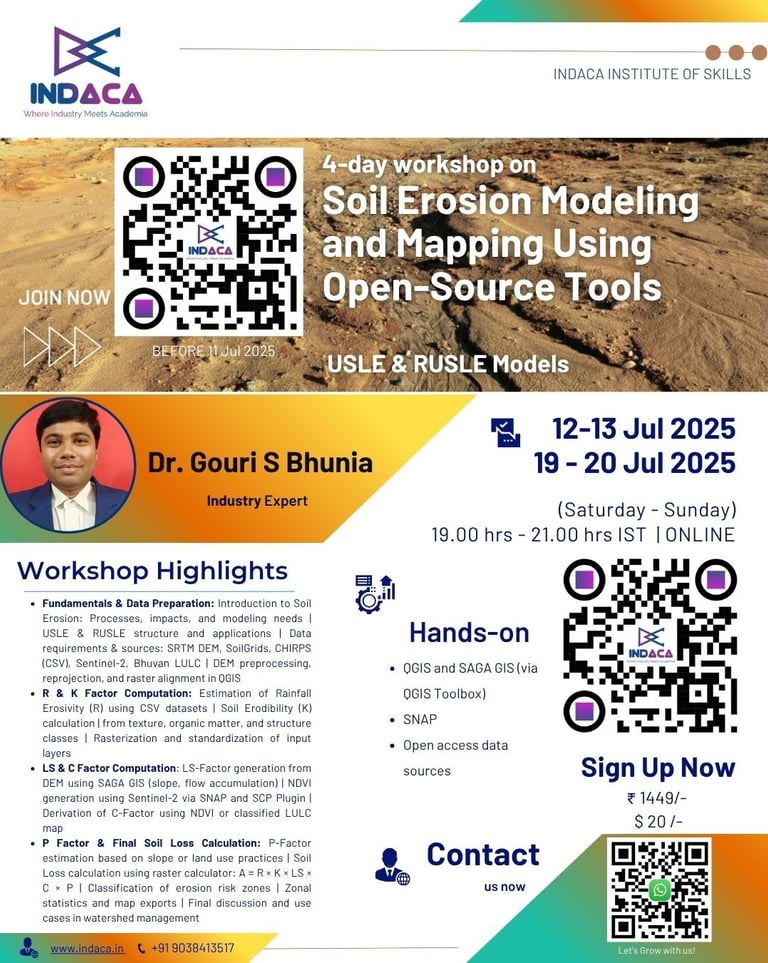
Instructor: Dr. Gouri Sankar Bhunia, Remote Sensing and GIS Specialists | Author | 16+ years of industrial and academic experience
Workshop Highlights
In-depth understanding of mountain hazards and slope movement processes
Step-by-step training in terrain analysis and susceptibility factor preparation
Practical experience in landslide susceptibility and risk zonation mapping
Exposure to open datasets (DEM, rainfall, geology, LULC, OSM)
Skills to create vulnerability and exposure maps using population and infrastructure data
Ability to integrate hazard, vulnerability, and exposure for comprehensive risk assessment
Confidence to export and publish professional-quality maps for reports and research
Who Should Attend?
Researchers & Academics: In environmental science, geography, agriculture, hydrology, and disaster management
University faculty and students working on mountain ecosystems
Students & Scholars: Pursuing projects in remote sensing, GIS, or environmental monitoring.
GIS professionals in consulting, government, and NGOs
Disaster management practitioners and planners
Anyone keen to apply open-source geospatial tools for hazard & risk mapping
Why Choose This Course?
Live + Recorded Access
Expert Instructor: Dr. Gouri S Bhunia brings deep expertise from academia and industry.
Industry-Relevant Tools: Work on real-world datasets
Get Certified
Emphasis on open-source tools – no expensive software needed
Registration Closes: October 9, 2025
Don’t miss the chance to master hazard and risk mapping for mountain environments. Secure your seat today and take your GIS skills to the next level!
Registration Closes: Oct 9, 2025

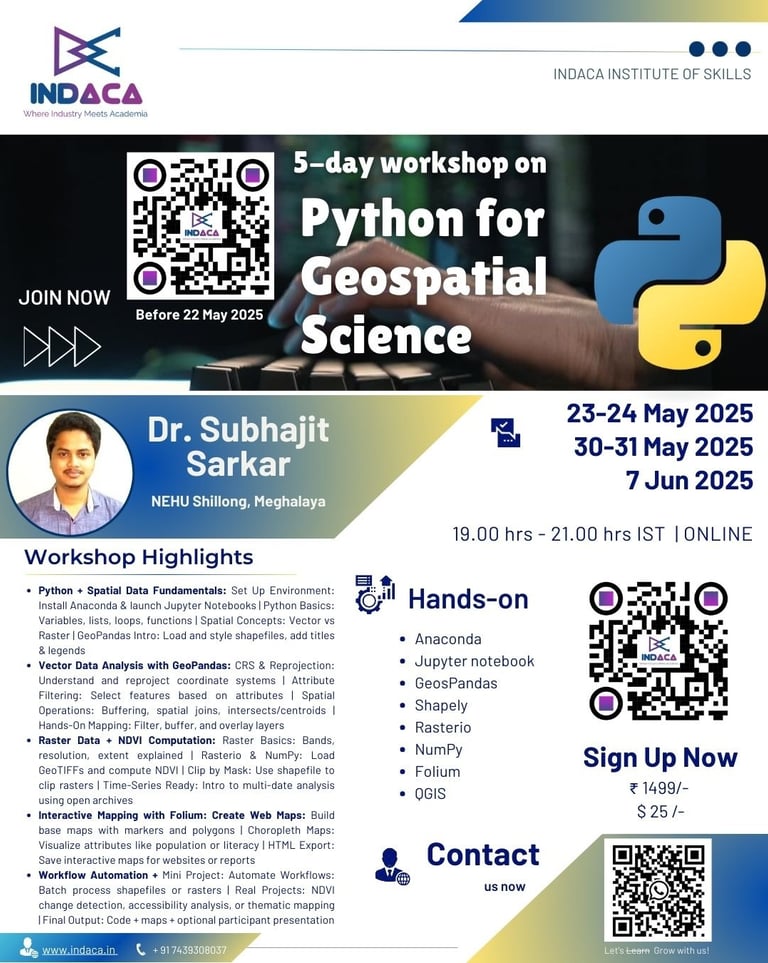
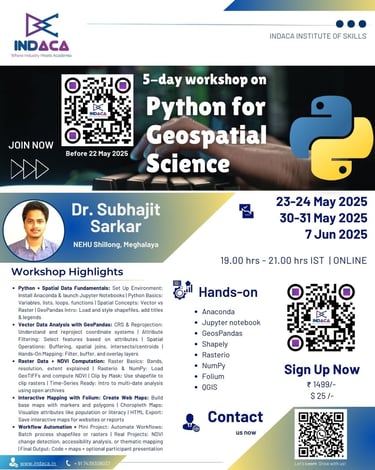
5 day Workshop-cum-hands-on-training on Python for Geospatial Sciences: From Basics to Automation!
This 5-day hands-on workshop is designed to introduce participants to Python programming for geospatial applications. It progressively builds skills in spatial data processing, visualization, and automation using Python libraries like GeoPandas, Rasterio, Folium, and NumPy.
The course is tailored for GIS professionals, researchers, and students who are comfortable with basic GIS concepts but new to Python. By the end of the program, participants will be able to handle both vector and raster geospatial data, perform spatial analysis, and automate workflows using real-world datasets.
Course Details:
Dates: May 23, 24, 30, 31 & June 7, 2025 (Fridays & Saturdays)
Time: 7:00 PM – 9:00 PM IST
Mode: Online (Live & Hands-on)
Skill Level: Beginners with basic GIS knowledge, no prior Python experience
Duration: 5 Days | 2 Hours per Day | Total 10 Hours
Language of Instruction: English
Certificate: E-Certificate of Participation
Workshop Highlights
5 Days of Live Hands-On Sessions – Learn by doing with structured 2-hour weekend classes (Friday & Saturday evenings).
No Prior Python Knowledge Needed – Designed for beginners with basic GIS understanding.
End-to-End Learning Path – From Python fundamentals to real-world geospatial automation.
Practical Tools & Libraries – Master GeoPandas, Rasterio, NumPy, and Folium for spatial data analysis and visualization.
Mini Project on Final Day – Apply your learning in a guided mini-project using real spatial data.
Interactive Mapping – Build and export web-based interactive maps with Folium.
Expert Instruction – Learn from Dr. Subhajit Sarkar, a domain expert in geospatial data science.
Session Recordings Access – Get exclusive access to recordings via your registered Gmail account.
Certificate of Participation – Issued by Indaca Institute of Skills upon completion.
What You’ll Learn:
Python +Spatial Data Fundamentals
Installing Anaconda and setting up Jupyter Notebooks
Python fundamentals:
Variables, data types (strings, numbers, lists)
Writing basic loops and functions
Introduction to spatial data types: Vector vs Raster
Loading and visualizing a shapefile using GeoPandas
Vector Data Analysis with GeoPandas
Coordinate Reference Systems (CRS): Basics and reprojection
Attribute filtering and selection
Spatial operations:
Buffering
Spatial join
One geometry method (e.g., intersects() or centroid())
Raster Data + NDVI Computation
What is raster data? (bands, resolution, extent)
Loading GeoTIFF using Rasterio
Raster to NumPy array conversion
NDVI calculation using Red and NIR bands
Raster clipping using shapefile masks
Interactive Mapping with Folium and Workflow Automation + Mini Project Showcase
Introduction to Folium and Leaflet-based maps
Creating base maps
Adding markers and polygons from GeoDataFrames
Building choropleth maps based on attribute data
Exporting maps as standalone HTML
Automating tasks using loops and functions
Batch processing examples:
NDVI computation for multiple rasters
Buffer multiple shapefiles
Mini project: Apply everything learned
Project options (participants choose one):
Land cover change NDVI analysis
Spatial accessibility mapping
Thematic mapping from census data
Tools and Technologies
Python Environment
Anaconda – Python distribution with package and environment management
Jupyter Notebook – Interactive coding and visualization platform
Vector Data Handling
GeoPandas – For reading, analyzing, and visualizing shapefiles and GeoJSON data
Shapely – For geometric operations like buffer, centroid, and intersects
Raster Data Analysis
Rasterio – For reading, writing, and clipping GeoTIFF raster files
NumPy – For raster band math (e.g., NDVI computation)
Interactive Mapping
Folium – For creating web-based interactive maps and choropleths
Supporting Tools
QGIS (optional reference) – For spatial data preparation (optional, not used in core hands-on)
Basic CSV/Excel Data – For attribute enrichment and visualization
Who Should Attend?
Students in Geography, Environmental Science, Urban Planning, Agriculture, and related fields
GIS Analysts and Technicians seeking to enhance their workflow with Python automation
Researchers and Academics working on spatial data analysis and visualization
Beginners in Python Programming with an interest in spatial applications
Educators and Trainers aiming to integrate Python-based GIS in their curriculum
Professionals in Remote Sensing, Planning, and Development sectors
No prior experience in Python is required. Basic familiarity with GIS concepts is recommended.
Why Choose This Course?
Live + Recorded Access
Expert Instructor: Dr. Subhajit Sarkar brings deep expertise from academia
Industry-Relevant Tools: Work on real-world datasets
Get Certified
No Prior Coding Required – All tools are cloud-based and user-friendly
Don't Miss Out!
If you're passionate about geospatial technology and eager to master Python for mapping and automation, this workshop is designed just for you!
Registration Closes: May 22, 2025
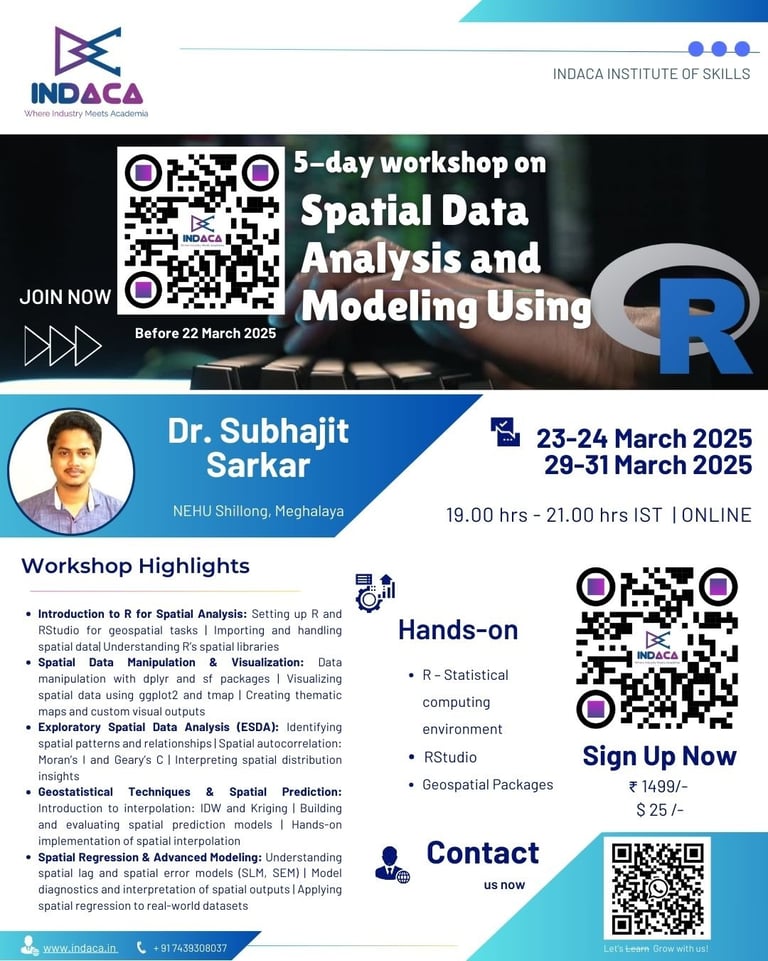
Join 5-Day Workshop on Spatial Data Analysis & Modeling Using R!
This comprehensive hands-on workshop is designed for GIS professionals, data scientists, and researchers eager to master spatial data analysis using R and RStudio. Learn to manipulate, visualize, and model spatial data using industry-standard open-source tools while working on real-world datasets in an interactive, practical setting.
What You'll Gain:
Master Spatial Data Handling – Import, manipulate, and analyze spatial datasets (Shapefiles, GeoTIFFs).
Explore Spatial Patterns – Conduct Exploratory Spatial Data Analysis (ESDA) and understand spatial relationships using Moran’s I and Geary’s C.
Apply Geostatistical Techniques – Implement spatial interpolation methods like Inverse Distance Weighting (IDW) and Kriging for spatial predictions.
Perform Spatial Regression – Build and interpret spatial regression models (SLM, SEM) for advanced spatial analysis.
Hands-On Practice – Gain practical experience with RStudio and essential R packages (sf, ggplot2, spdep, gstat, spatialreg).
📊 Course Highlights:
Introduction to R for Spatial Analysis: Setting up R and RStudio for geospatial tasks | Importing and handling spatial data| Understanding R’s spatial libraries
Spatial Data Manipulation & Visualization: Data manipulation with dplyr and sf packages | Visualizing spatial data using ggplot2 and tmap | Creating thematic maps and custom visual outputs
Exploratory Spatial Data Analysis (ESDA): Identifying spatial patterns and relationships | Spatial autocorrelation: Moran’s I and Geary’s C | Interpreting spatial distribution insights
Geostatistical Techniques & Spatial Prediction: Introduction to interpolation: IDW and Kriging | Building and evaluating spatial prediction models | Hands-on implementation of spatial interpolation
Spatial Regression & Advanced Modeling: Understanding spatial lag and spatial error models (SLM, SEM) | Model diagnostics and interpretation of spatial outputs | Applying spatial regression to real-world datasets
Mark your calendars for March 23-24 and March 29-31, 2025 as the program kicks off with weekend sessions held on Saturdays and Sundays, totaling 4-6 hours of live classes and projects. Join us online via Zoom Meet from 19:00 HRS to 21:00 HRS (IST) and unlock your potential in the world of bibliometric study.
🎓 Who can join?
GIS Professionals: Enhance your geospatial modeling expertise with advanced techniques.
Data Scientists: Apply spatial analysis to complex datasets and derive actionable insights.
Researchers & Academicians: Analyze geographic patterns for real-world applications in urban and environmental studies.
Urban & Environmental Planners: Integrate spatial analytics into planning and policy decisions.
Students & Aspiring Analysts: Build a strong foundation in spatial statistics and modeling
Benefits of Choosing INDACA:
Certificate of Completion: Receive a recognized certificate from Indaca Institute of Skills, validating your spatial data expertise.
Session Recordings Access: Get access to recorded sessions to revisit and reinforce your learning anytime.
3-Month Post-Workshop Support: Enjoy continued guidance and assistance as you apply your new skills.
Affordable Registration Fees: Join the workshop for just INR 1499/- or USD 20/-—making advanced learning accessible.
Enrollment is now open, with registration closing on 22March 2025. Get ready to transform raw data into actionable insights! Join us to simplify bibliometric analysis and elevate your research. For inquiries and enrollment, call or WhatsApp us at +91 7439308037.